Data Science Projects
Data Consulting
I’ve consulted for MI companies on data analysis and data visualization projects through the Community Technical Assistance Collaborative (CTAC) at UM. Many of the GitHub repositories for these are private due to the sensitive nature of the data involved. Projects include:
- Data visualization and geospatial data analysis for Brilliant Detroit and the Girl Scouts of Southeastern Michigan, allowing orgs to more effectively allocate resources
- Interactive dashboard visualizations for MI-CEMI to empower cross-functional collaboration [GitHub]
- Data analysis for OLHSA to assess community needs
- Python & Bash visualization tutorials for CTAC
BERT-based LLMs for PII Detection [GitHub] [Slides]
This is a team project done for the Erdos Institute’s Deep Learning Bootcamp. The goal is to create a reliable automated method of detecting personally identifiable information (PII) in educational materials, such as student essay submissions. The data used was provided by the Learning Agency Lab through a Kaggle competition.
Our team leveraged transfer-learning by fine-tuning the BERT-based LLMs DeBERTa and RoBERTa. We tokenized our raw data with each model’s native tokenizer and trained them on the labeled, tokenized data. As the models only have a finite maximum token sequence length for training, choosing how to pre-process the data became essential so as not to miss PII.
The data consisted of of 6,807 student submissions (both full-text and tokenized).
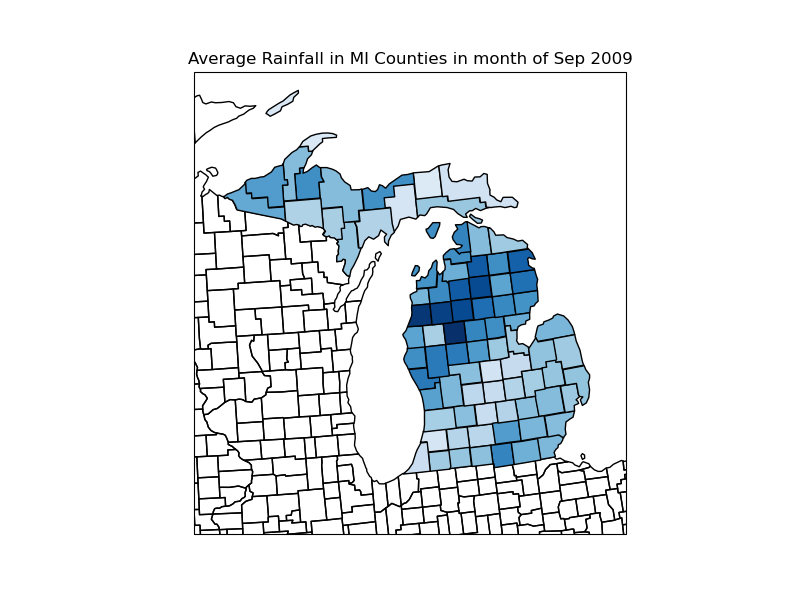
Michigan Climate & Weather Data Viz [GitHub][Link]
This is a personal project I did on visualizing and detecting climate change using monthly weather data from the National Oceanic and Atmospheric Administration (NOAA), from 1900 until today. I scraped and cleaned data from the NOAA API using Python, then used various GIS Python packages (cartopy, geopy) as well as Tableau to get some nice visualizations.
There are more than 1,000 NOAA stations in Michigan; to get county-level readings, I averaged data taken at all stations in a given county. Stations report their FIPS code (a three-digit code that uniquely identifies the county; see here).
Right now, the visualization displays county-level rainfall data. In the future, I plan to add other types of data.
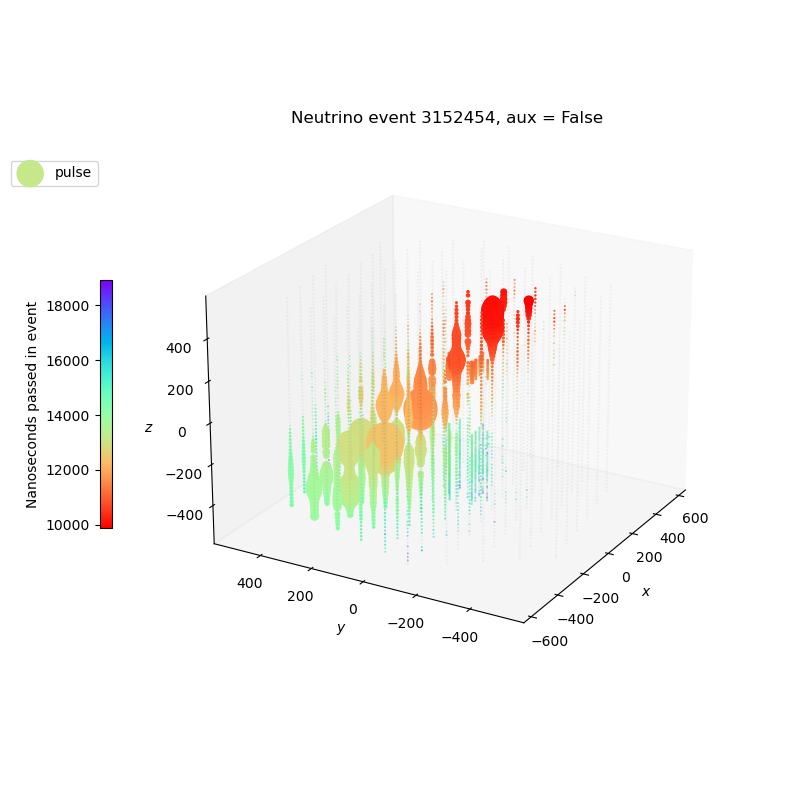
Neutrino Direction Detection [GitHub] [Slides]
This is a team project done for the Erdos Institute’s Data Science Bootcamp. The goal is to determine an effective, computationally efficient model for computing the direction of incoming neutrinos using data collected from the IceCube Neutrino Observatory provided through a Kaggle competition.
Neutrinos are detected indirectly through Cherenkov radiation, an electromagnetic analog of a sonic boom produced by neutrinos traveling faster-than-light in ice. The detector’s 5,160 optical sensors detect the photons emitted from Cherenkov radiation, and the job is to reconstruct the path of the neutrino.
The data provided by Kaggle consisted of 660 parquet files, each consisting of around 200,000 individual neutrino events.